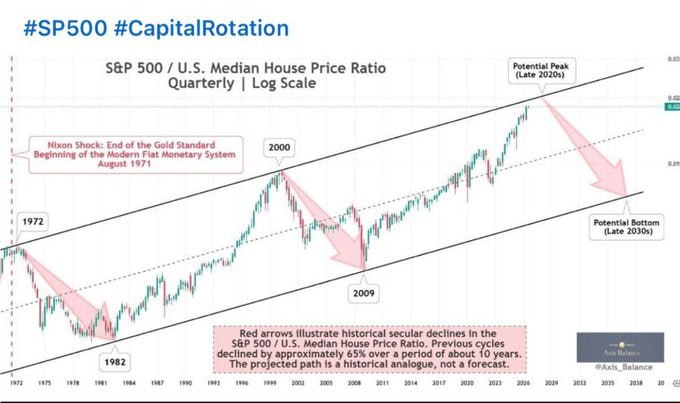
The ratio of the S&P 500 to the median price of a U.S. home tells less of a story about real estate than it does about the relative price of financial assets compared to real assets.
Following the Nixon Shock of 1971, this ratio experienced two major periods of contraction: 1972–1982, and then 2000–2009. In both cases, the correction was close to 65% over the course of about a decade.
Today, the ratio is returning to the upper end of its long-term channel. This obviously does not mean that history must mechanically follow the same path through the late 2030s. But the analogy is worth examining, particularly at a time when financial valuations are reaching extremes, while gold, commodities, energy, and physical infrastructure are gradually regaining their strategic value.